Surveys
Made Explorable
Your interactive, 360-degree dashboards into analysing what people think.
Keshif’s survey solutions enable organizations to collect high quality data, and apply exploratory analytics in order to reach and visually communicate data-driven insights with depth and clarity.

Your route to visual insights on survey data across sectors
Our technology enables rapid multi-dimensional analysis of snapshot, longitudinal, or real-time data in a unified dynamic visual analytics environment. Our approach generates results for surveys across sectors, such as monitoring and evaluation, stabilization and finance, as well as activities such as perception analysis, benchmarking, and research.
Get depth and clarity with automated charts and analytics.
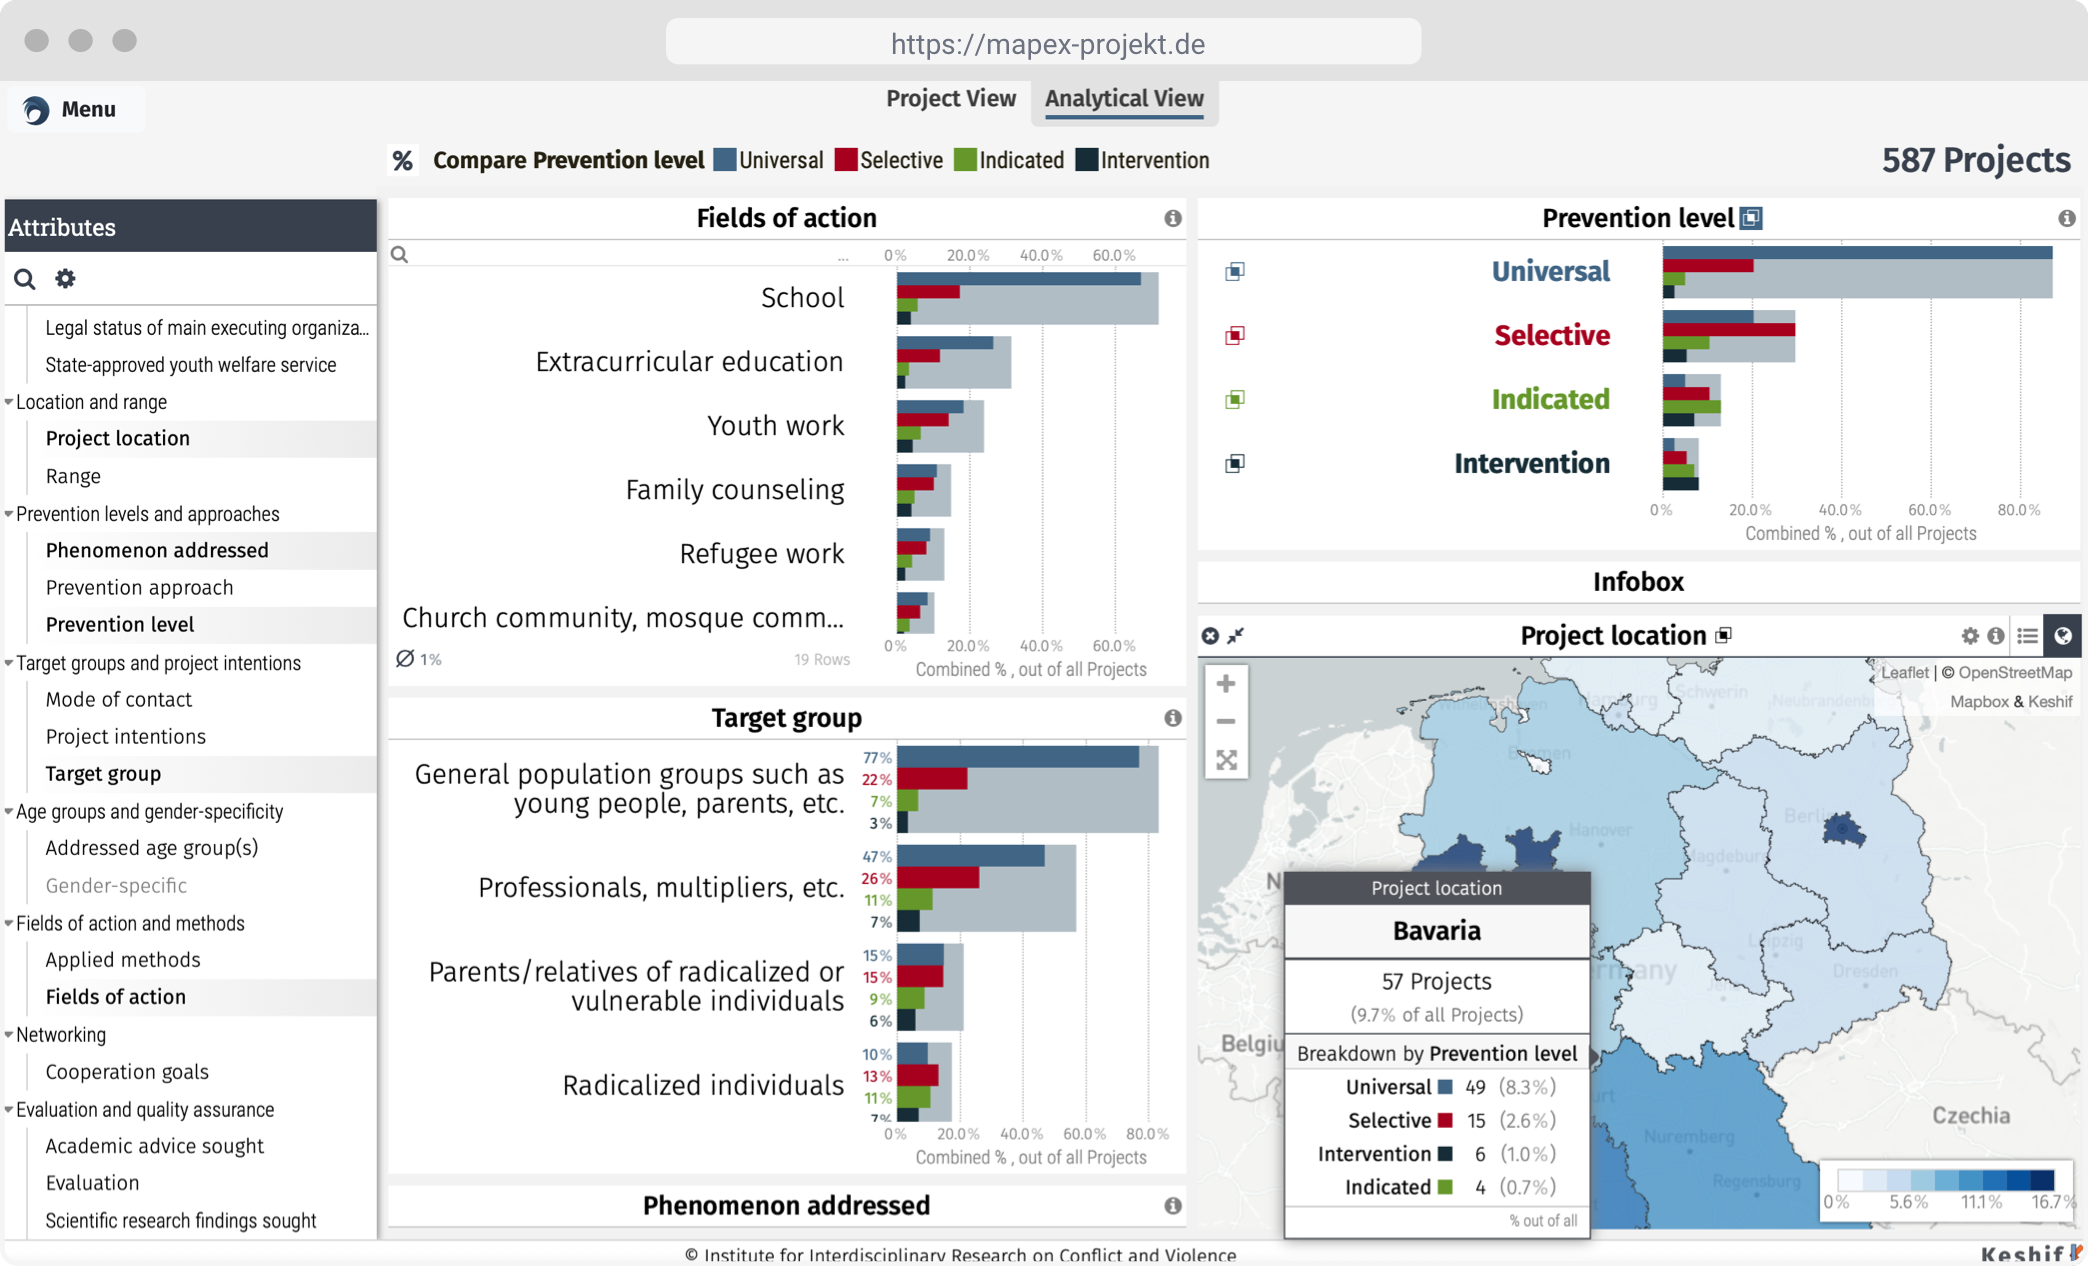
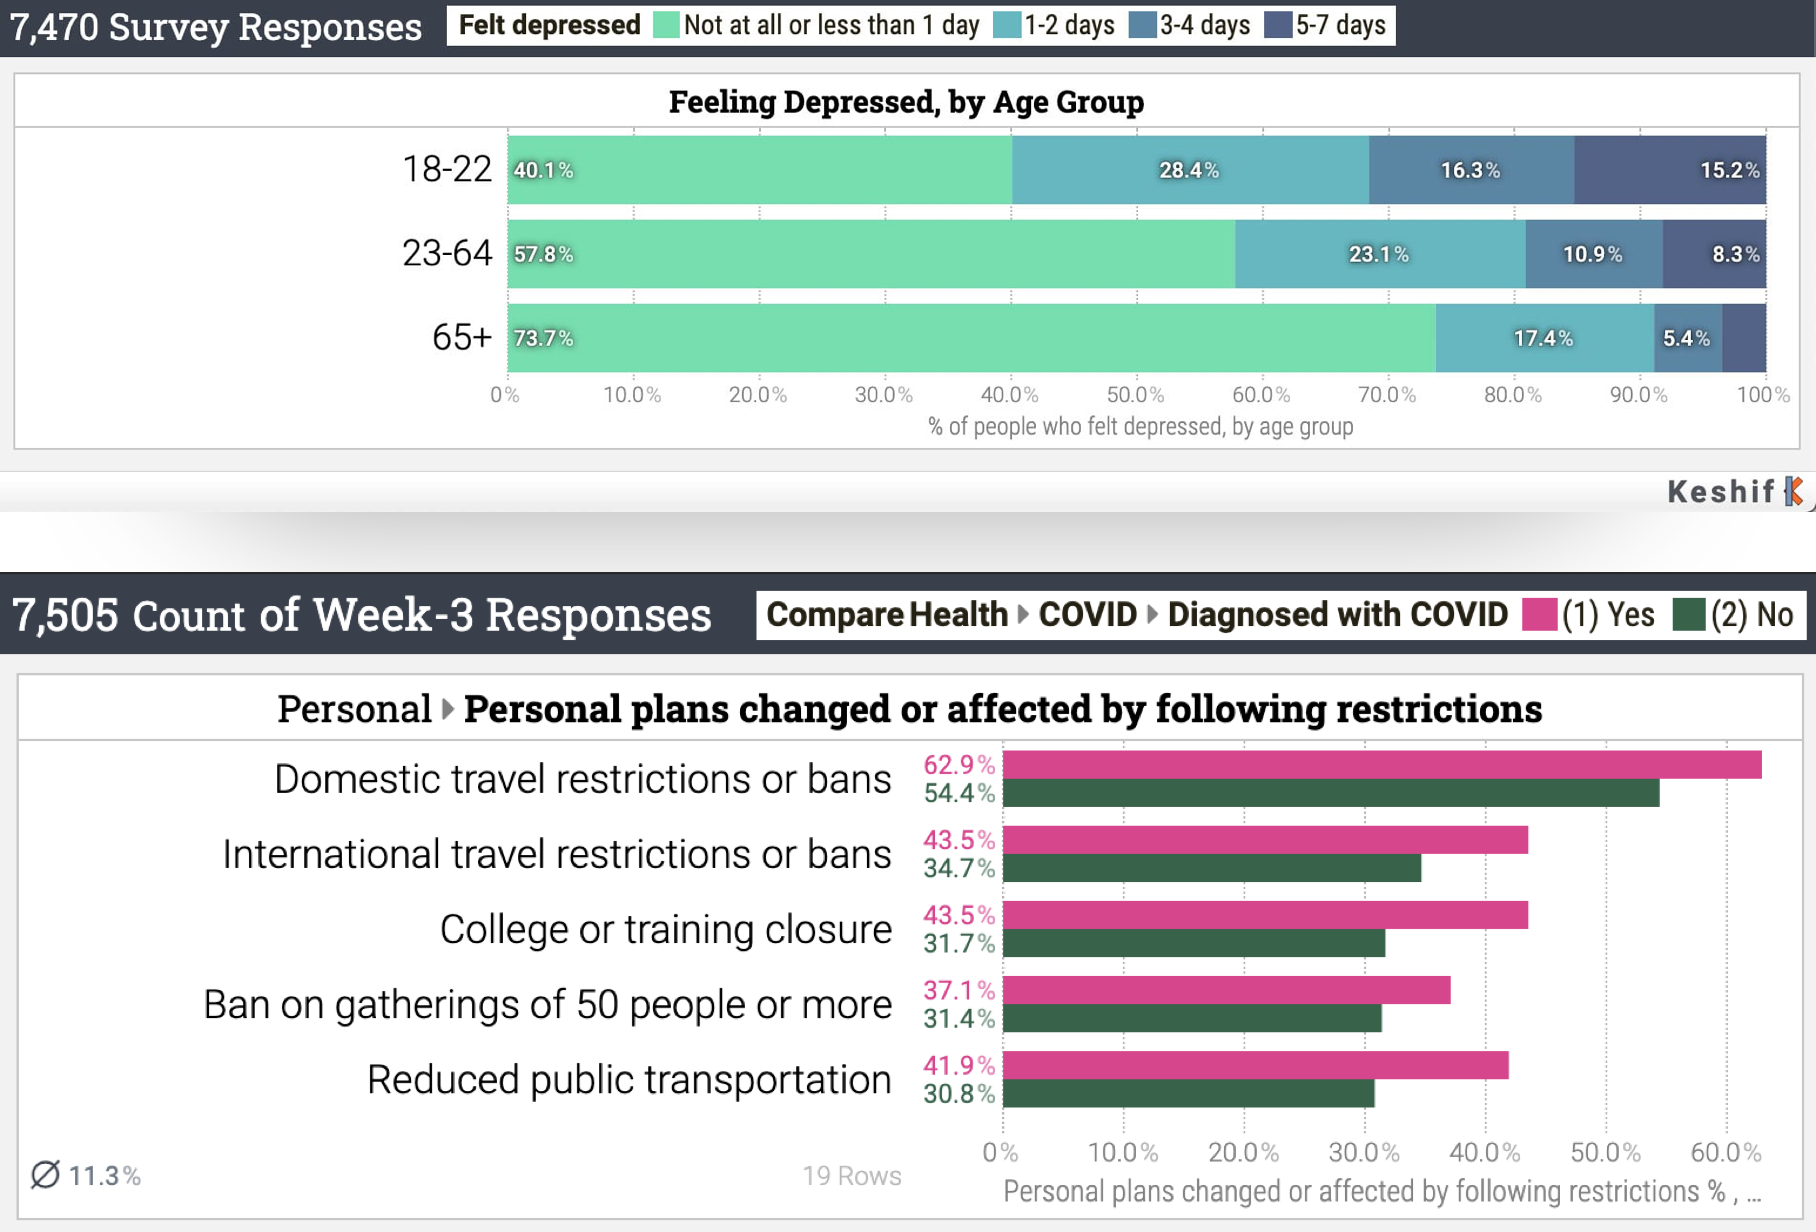
Our key differentiator is our rapid visual data exploration technology. With Keshif, analysts can create full-featured exploratory analysis dashboards that automatically generate the right charts based on data and analysis goals. With instant filtering, highlighting and comparison, they can uncover hidden trends across questions, and reach insights from overview to details.
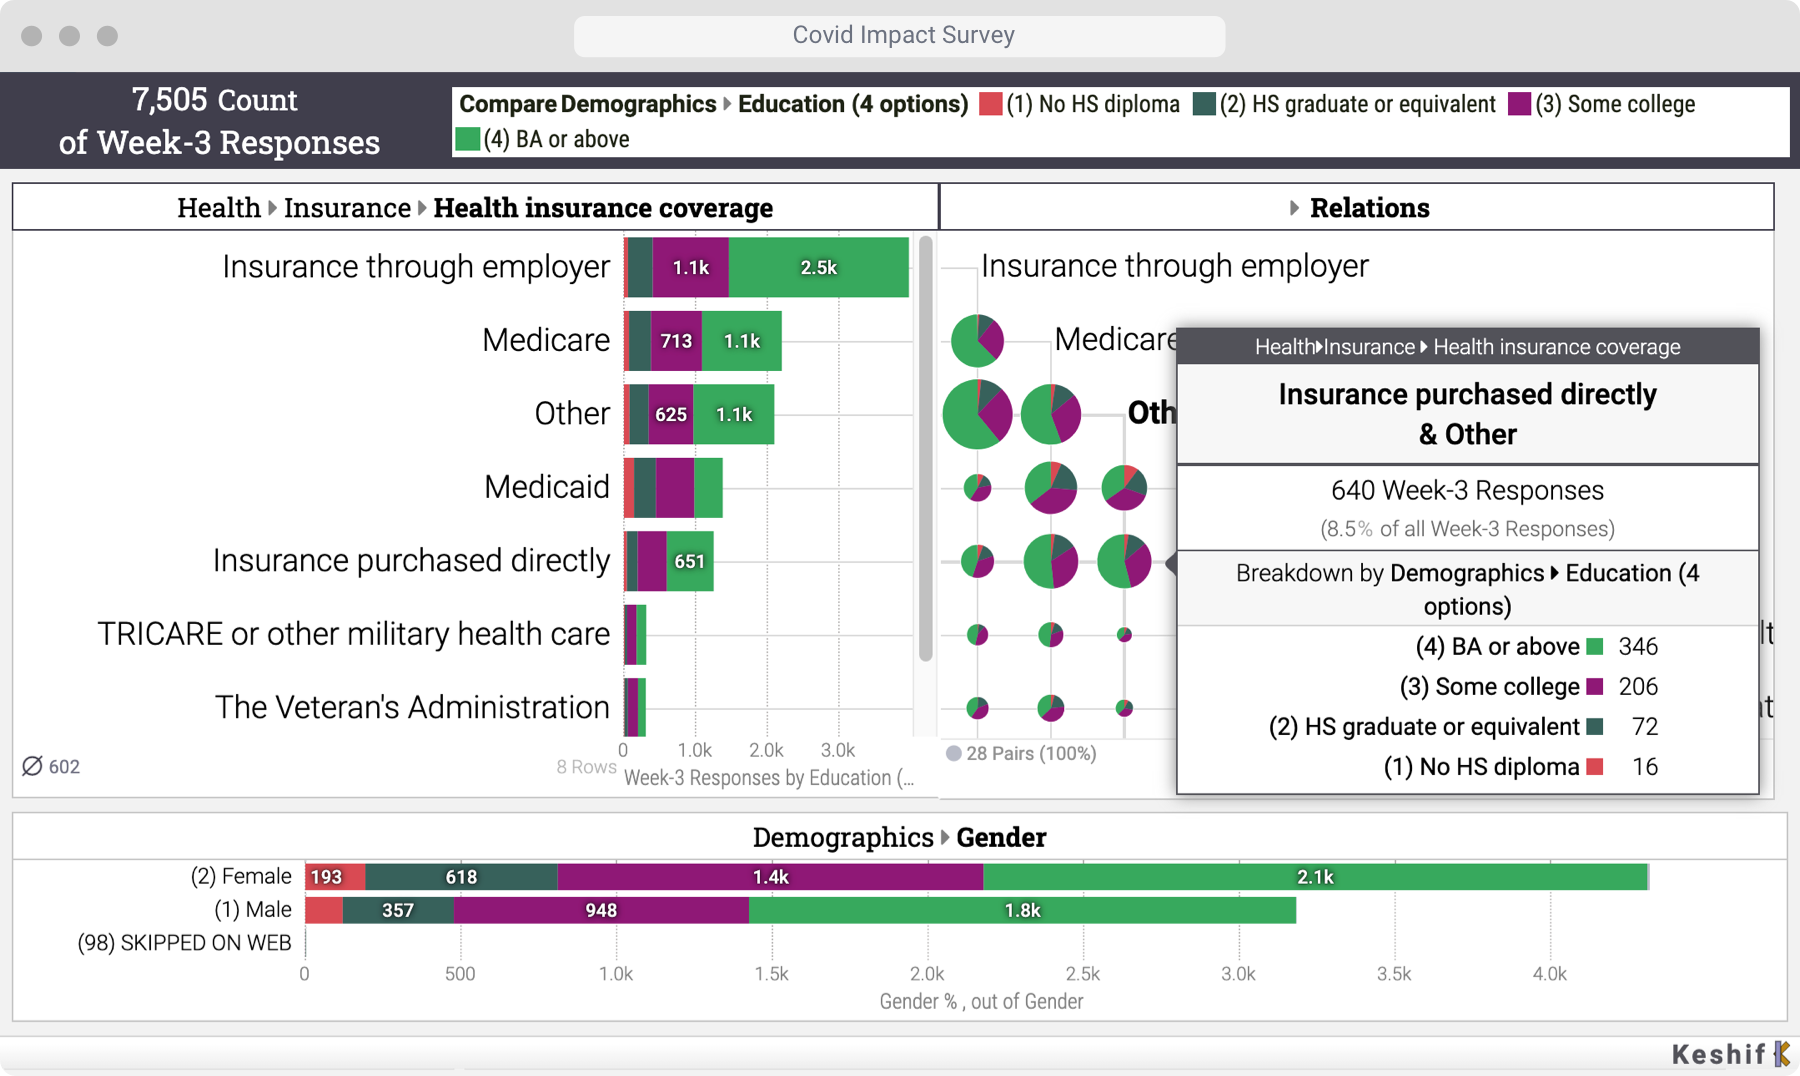
Discover geographic, demographic, or temporal trends with fully interactive charts and dashboards.

Easily filter out the irrelevant & focus on the specifics. Let dynamically updated charts show hidden data relations.
Access rich comparison breakdown modes that can reveal relative percentages and absolute numbers.
Author powerful analytical charts and dashboards with drag and drop features for any question instantly.
Integrate & explore from any data source.
Our solutions can connect to surveying tools used by the development sector such as Kobo Toolbox, Ona, and SurveyCTO, as well as commercial tools such as Google Forms, Microsoft Forms, Qualtrics, and Alchemy.
Collect new, reliable data from communities, experts, or organizations.
We translate complex concepts into tailored methodologies and digital data collection and management solutions following industry best practices
Surveys any time, anywhere, and any variety.
Our technology adopts to many types of survey questions, such as single/ multiple choice, Likert scale, numeric, time & more.
Access insights with public or private apps.
Our secure web applications can be accessible publicly for broad dissemination, or privately for analysts working with sensitive data.
Selected Projects & Partners
View all projects
DT Global
Analyzing the Propaganda and Misinformation in Yemeni Media

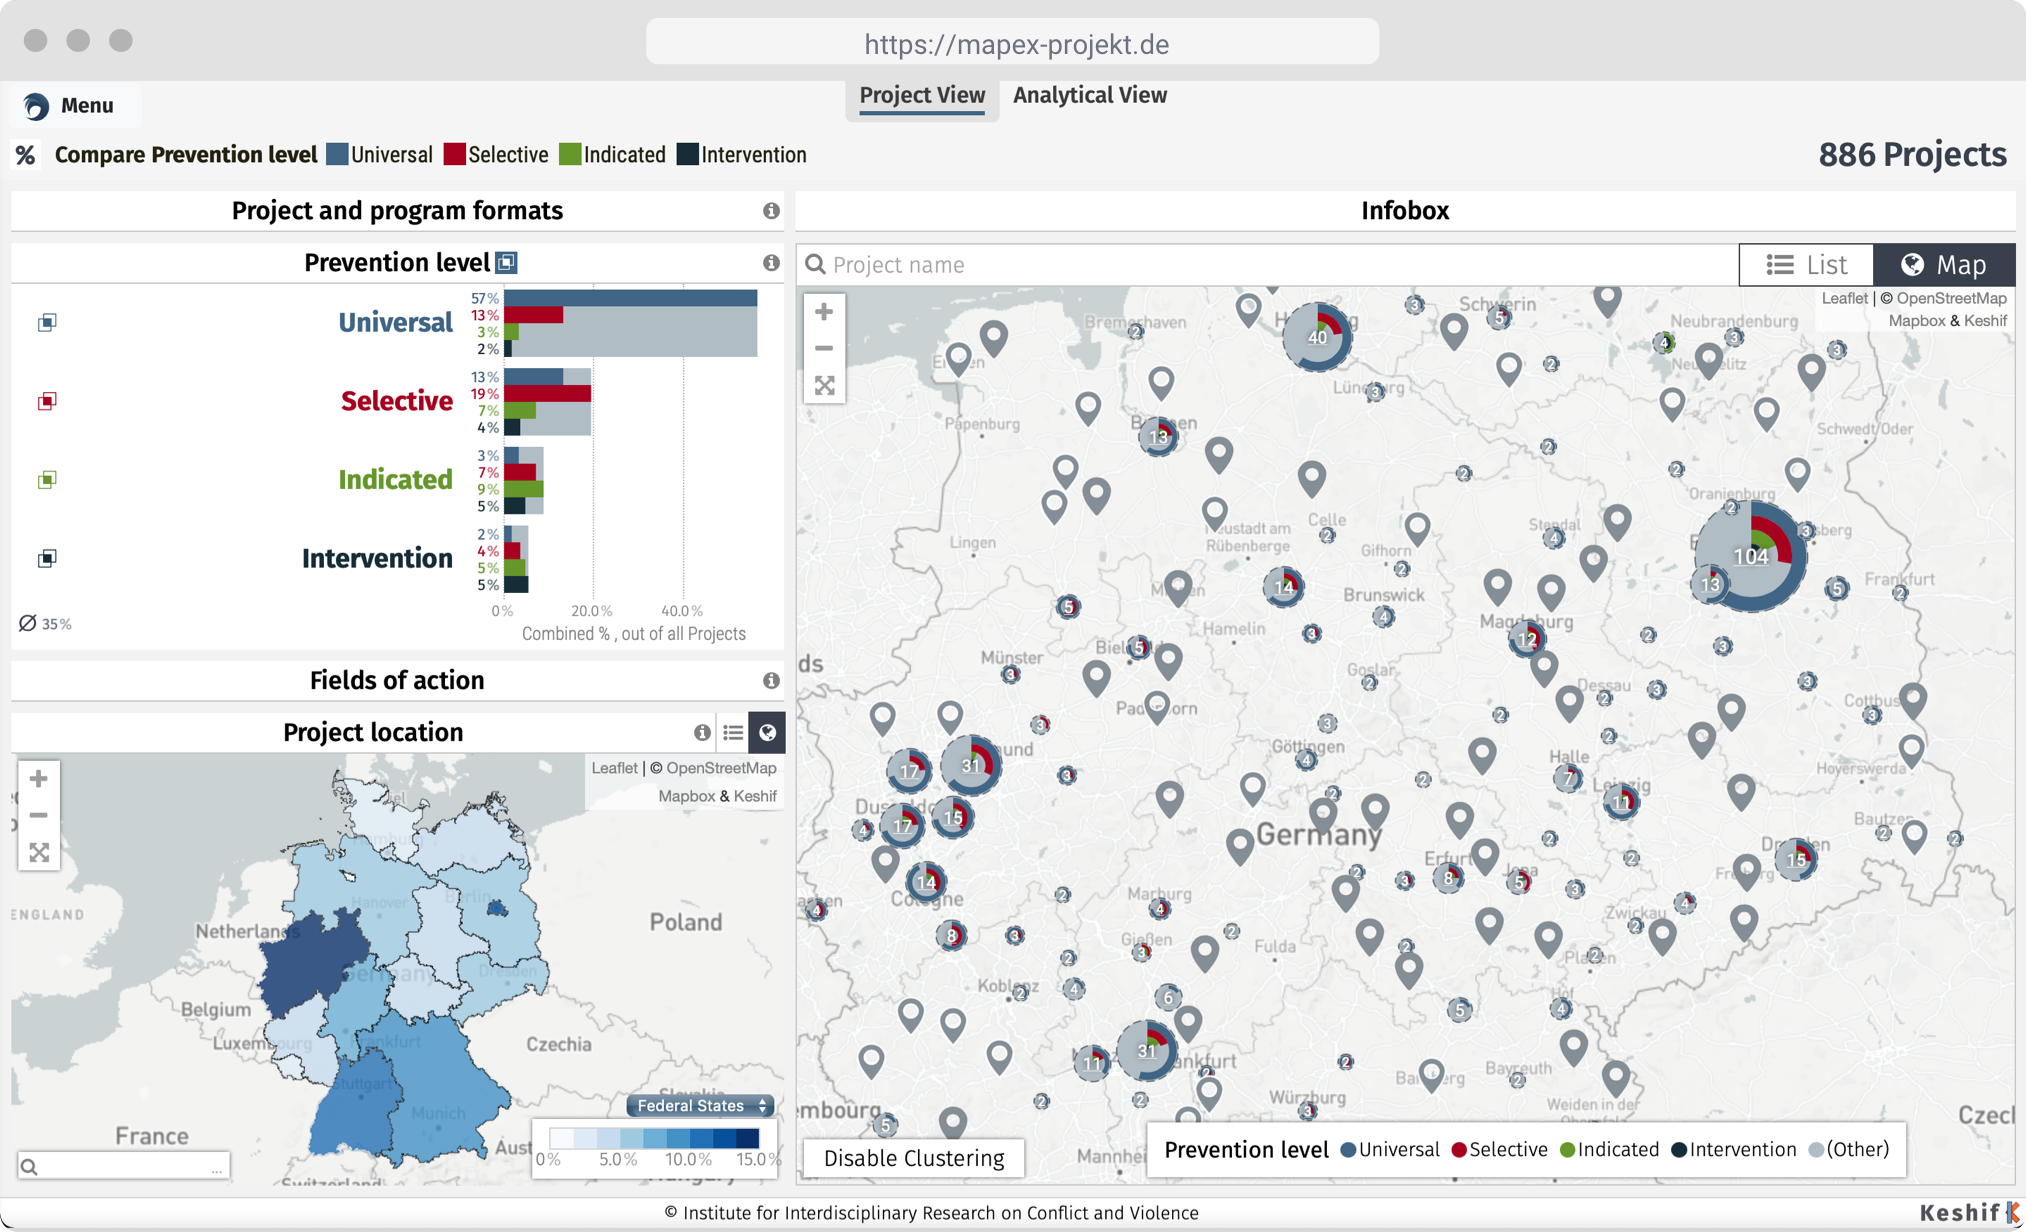
Institute for Interdisciplinary
Mapping the Deradicalization and Prevention Landscape in Germany

World Bank
Data-Driven Website for Benchmarking Infrastructure Development